Visualization MCP Server
Visualization MCP Server
A powerful Model Context Protocol (MCP) server for creating interactive data visualizations using matplotlib. This server provides comprehensive visualization tools including relationship graphs, scatter plots, 3D visualizations, and more.
Features
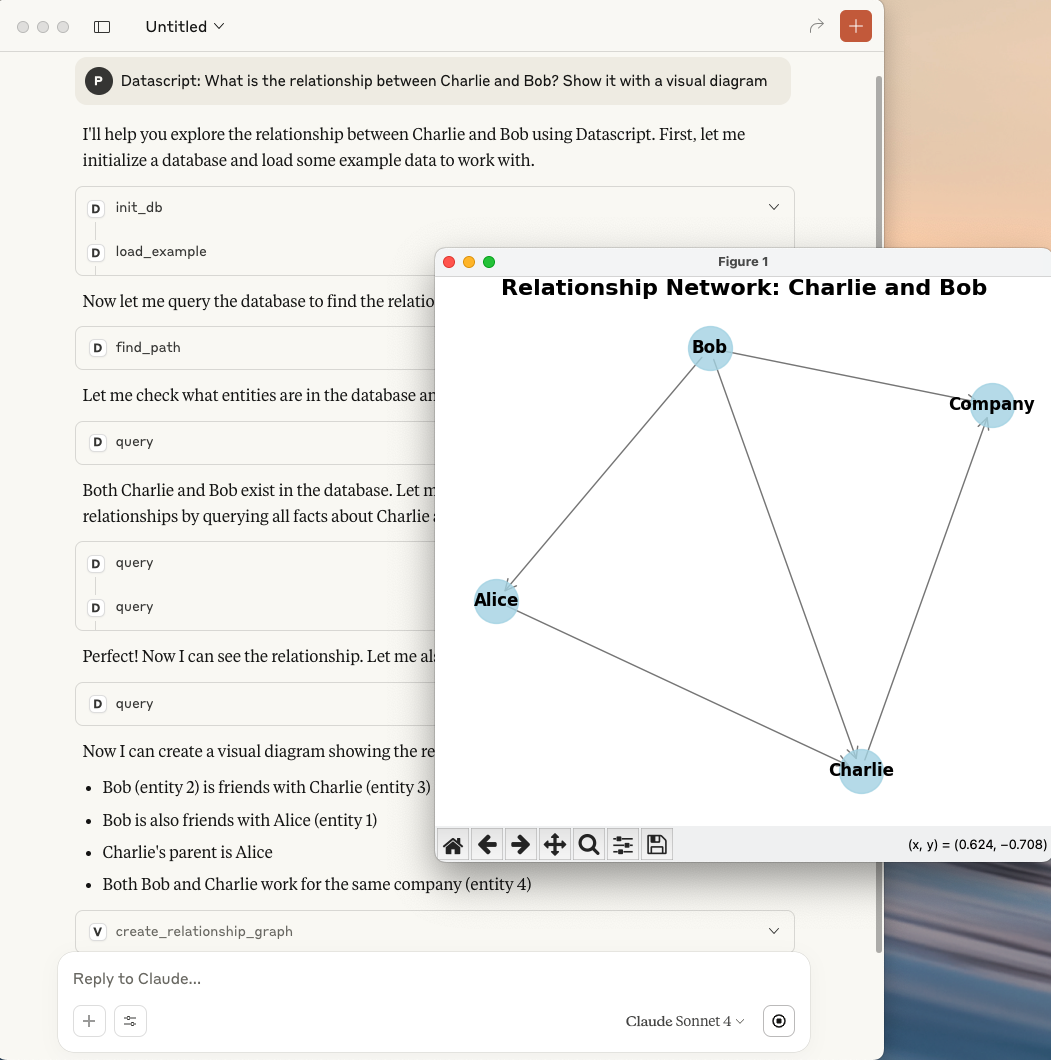
- 🔗 Relationship Graphs: Create network diagrams to visualize connections between entities
- 📊 Scatter Plots: Basic and classification scatter plots with customizable styling
- 🌐 3D Visualizations: Support for 3D scatter plots, surface plots, and wireframes
- 📈 Statistical Charts: Histograms, line plots, and heatmaps
- 💾 Auto-save: Automatically saves high-resolution images to temporary directory
- 🖼️ Live Display: Shows plots in interactive matplotlib windows
- 🎨 Customizable: Extensive styling options for colors, labels, and layouts
Installation
Prerequisites
$ python3 -m venv .venv --upgrade-deps

$ source .venv/bin/activate

$ pip install "mcp[cli]" httpx

$ pip install   matplotlib numpy pandas networkx
Clone and Run
git clone https://github.com/xlisp/visualization-mcp-server.git
cd visualization-mcp-server
python visualization_server.py
Usage
1. Cladue Desktop Client Config
    "visualization": {
      "command": "/Users/clojure/Desktop/visualization-mcp-server/.venv/bin/python",
      "args": [
        "/Users/clojure/Desktop/visualization-mcp-server/visualization_server.py"
      ]
    }
The server provides several visualization tools that can be called via MCP protocol:
1. Relationship Graph
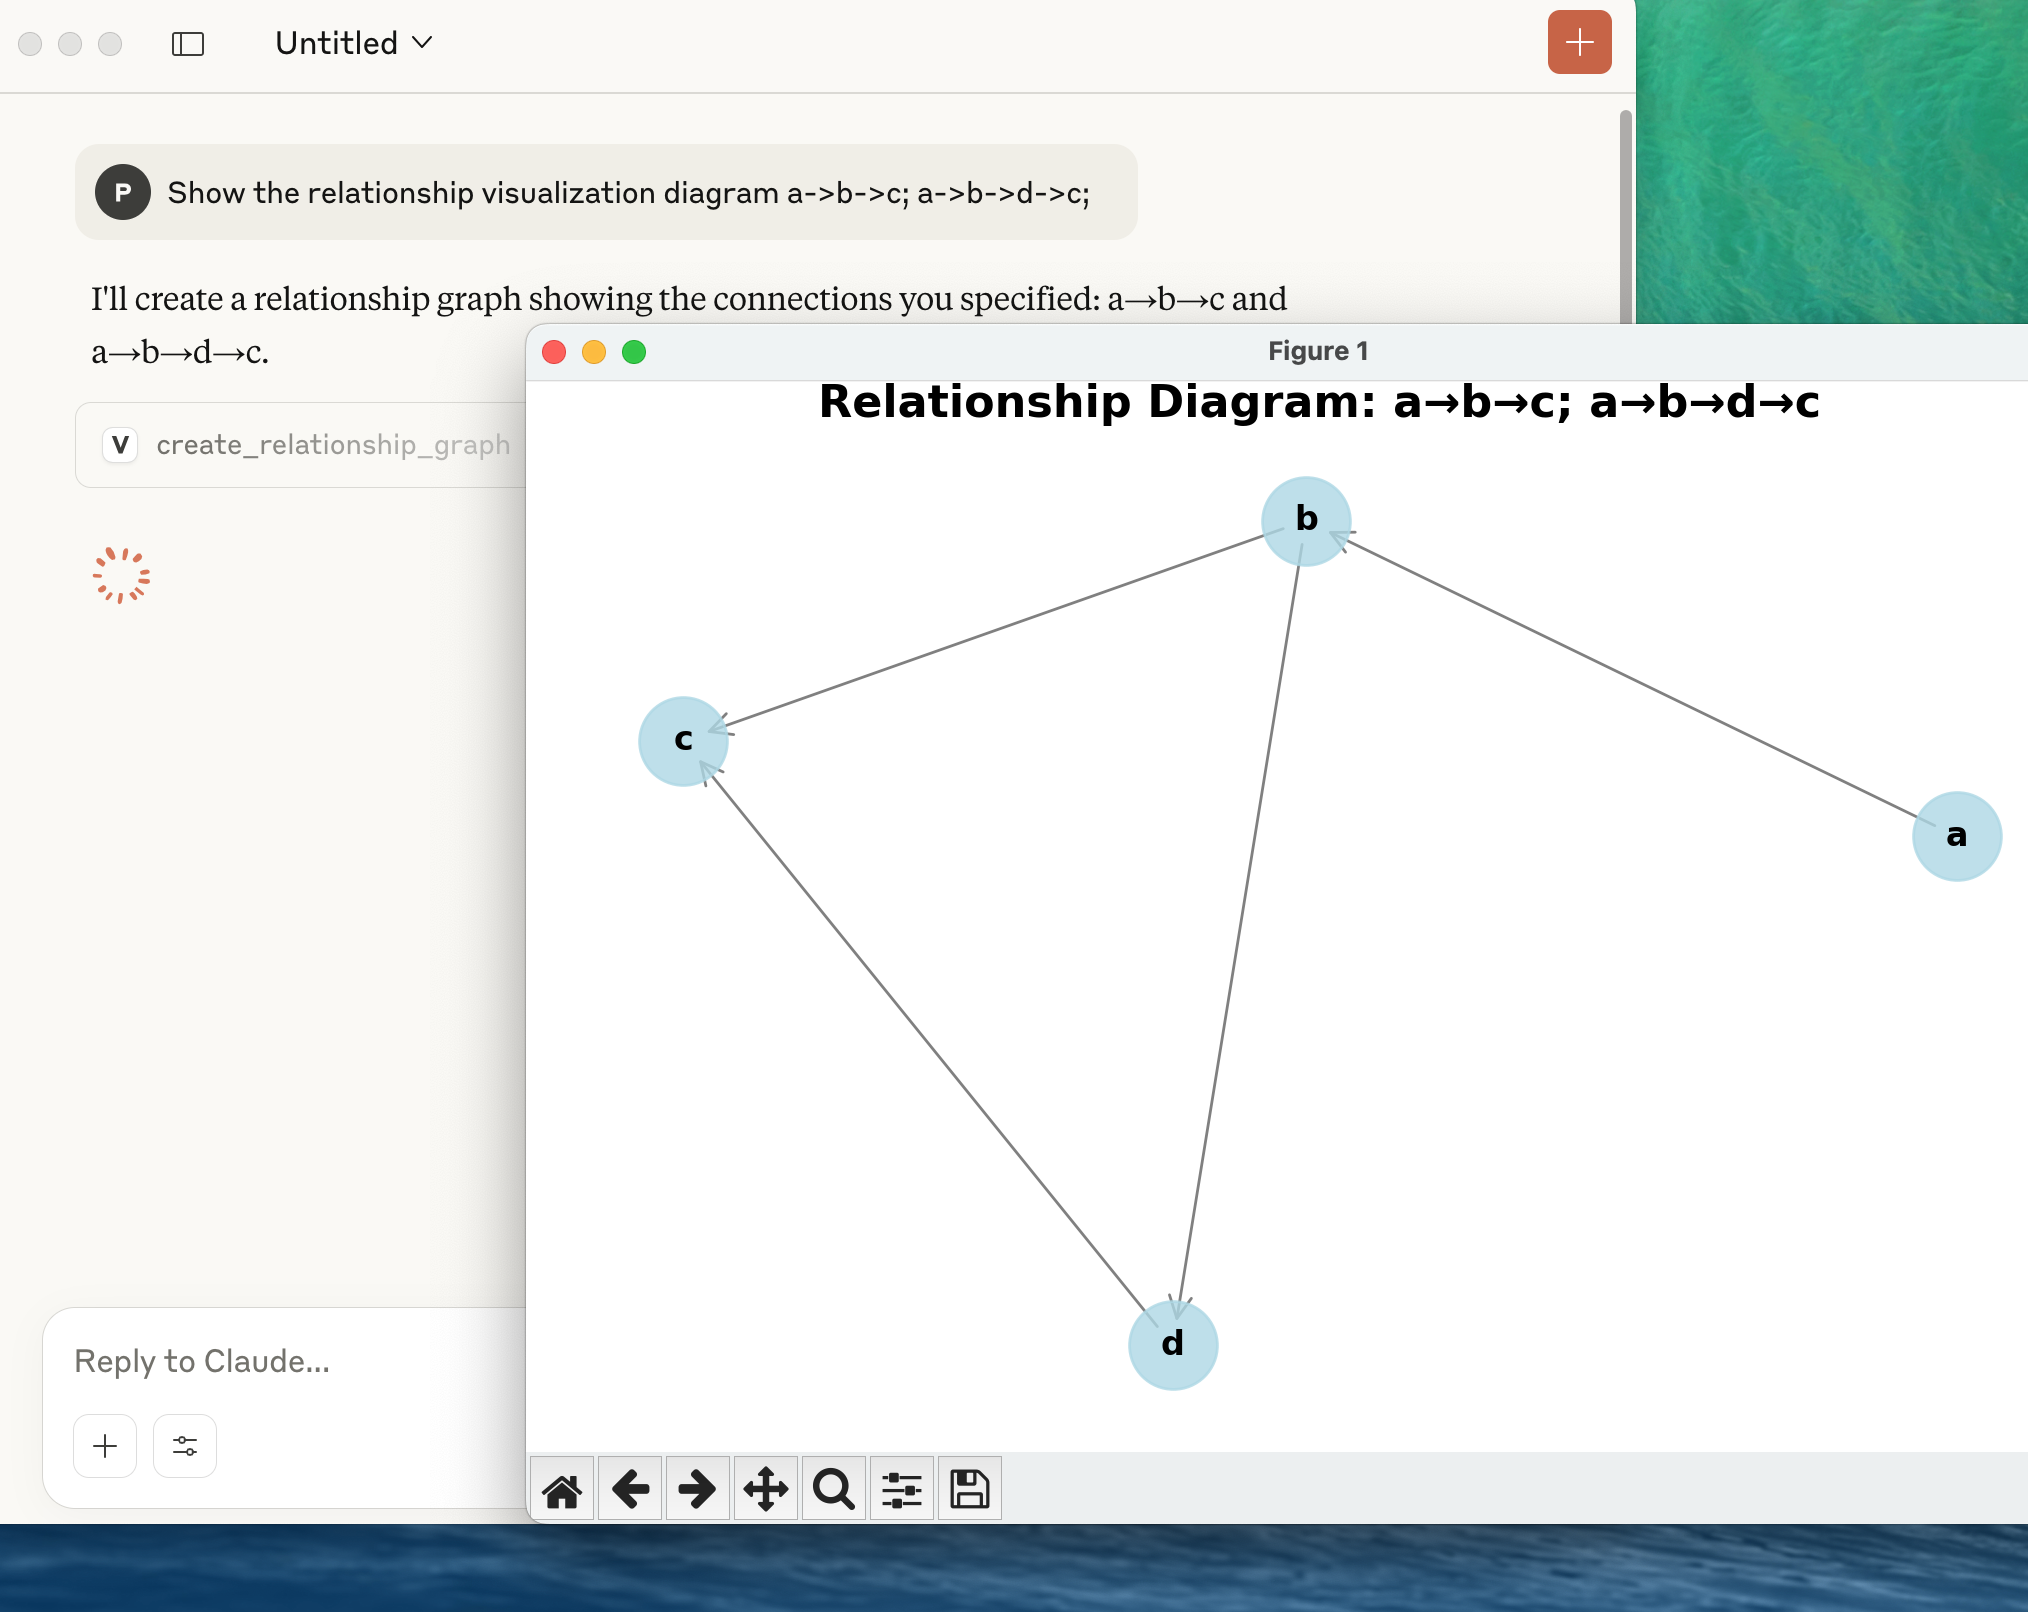
Create network diagrams to show relationships between entities:
# Example: Show relationships between A, B, C, D
nodes = ["Alice", "Bob", "Charlie", "Diana"]
edges = [["Alice", "Bob"], ["Bob", "Charlie"], ["Alice", "Charlie"], ["Charlie", "Diana"]]

# Call: create_relationship_graph(nodes, edges, "Social Network")
Parameters:
nodes: List of node namesedges: List of connections (pairs of node names)title: Graph title (optional)node_size: Size of nodes (default: 1000)font_size: Label font size (default: 12)
2. Scatter Plot
Create basic scatter plots with optional labels and colors:
# Example: Basic scatter plot
x_data = [1, 2, 3, 4, 5]
y_data = [2, 5, 3, 8, 7]
labels = ["Point A", "Point B", "Point C", "Point D", "Point E"]

# Call: create_scatter_plot(x_data, y_data, labels, title="My Scatter Plot")
Parameters:
x_data: X-axis valuesy_data: Y-axis valueslabels: Point labels (optional)colors: Point colors (optional)title,x_label,y_label: Chart labelssize: Point size (default: 50)
3. Classification Scatter Plot
Visualize data points grouped by categories:
# Example: Classification visualization
x_data = [1, 2, 3, 4, 5, 6]
y_data = [2, 3, 1, 5, 4, 6]
categories = ["Type A", "Type A", "Type B", "Type B", "Type C", "Type C"]

# Call: create_classification_plot(x_data, y_data, categories)
Parameters:
x_data: X-axis valuesy_data: Y-axis valuescategories: Category labels for each pointtitle,x_label,y_label: Chart labels
4. 3D Visualization
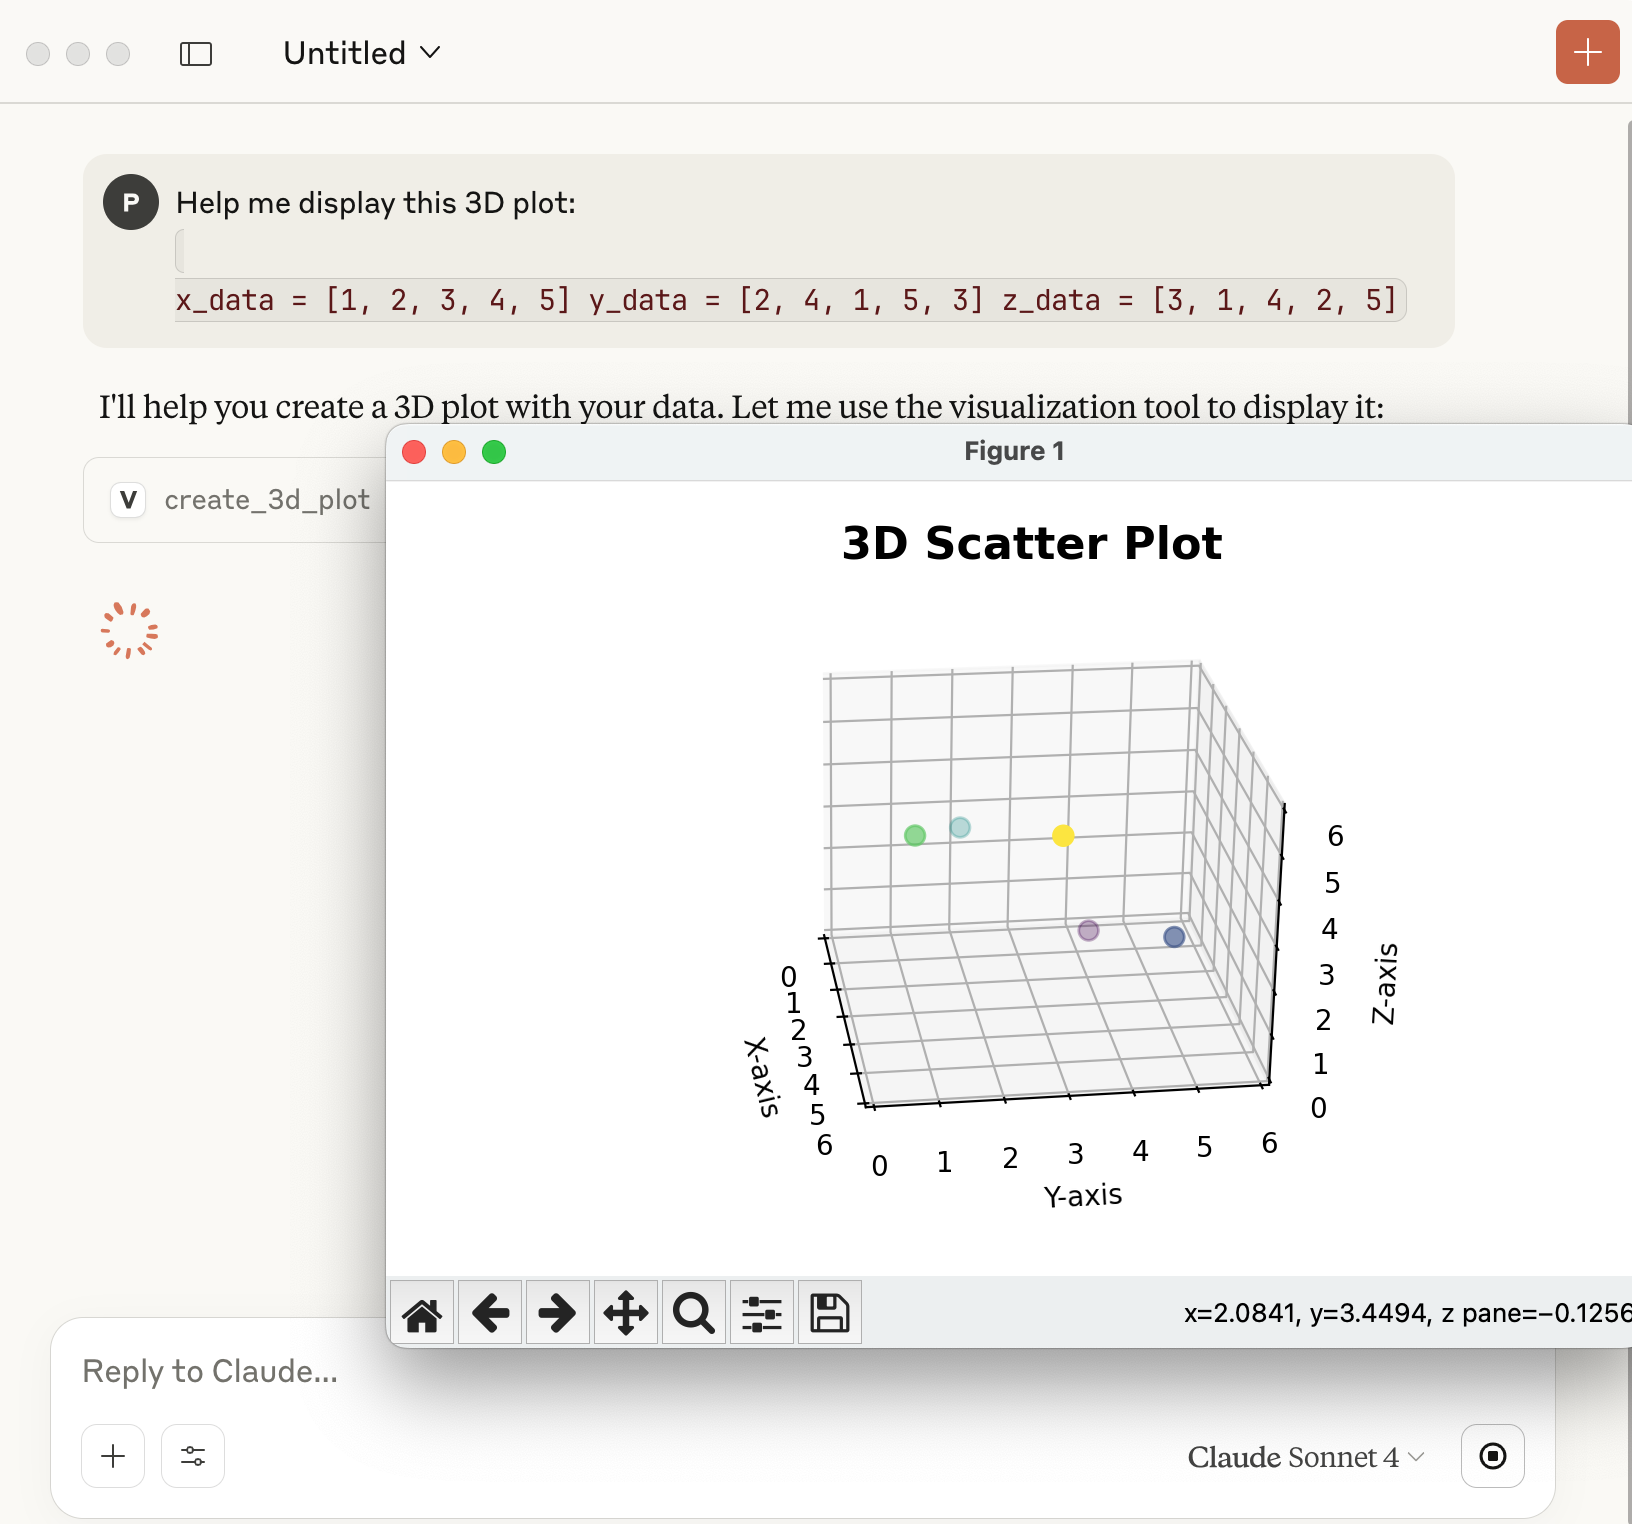
Create 3D plots with multiple visualization types:
# Example: 3D scatter plot
x_data = [1, 2, 3, 4, 5]
y_data = [2, 4, 1, 5, 3]
z_data = [3, 1, 4, 2, 5]

# Call: create_3d_plot(x_data, y_data, z_data, plot_type="scatter")
Parameters:
x_data,y_data,z_data: 3D coordinatesplot_type: "scatter", "surface", or "wireframe"title,x_label,y_label,z_label: Chart labels
5. Additional Charts
Histogram
# create_histogram(data, bins=30, title="Distribution")
Line Plot
# create_line_plot(x_data, y_data, line_style="-", color="blue")
Heatmap
# create_heatmap(data_matrix, x_labels, y_labels, colormap="viridis")
Output
Each visualization function:
- Displays the plot in an interactive matplotlib window
- Saves a high-resolution PNG file to the system temporary directory
- Returns the file path where the image was saved
Example output:
"Graph saved to: /tmp/relationship_graph_20250802_143022.png and displayed"
File Management
- Images are saved with timestamps to avoid conflicts
- Files are stored in the system temporary directory:
- Windows:
C:\Users\username\AppData\Local\Temp\ - macOS/Linux:
/tmp/
- Windows:
- High resolution (300 DPI) PNG format
MCP Integration
This server follows the Model Context Protocol standard and can be integrated with MCP-compatible clients. The server runs on stdio transport by default.
Server Configuration
if __name__ == "__main__":
    mcp.run(transport='stdio')
Examples
Social Network Analysis
# Visualize social connections
nodes = ["Alice", "Bob", "Charlie", "Diana", "Eve"]
relationships = [
    ["Alice", "Bob"],
    ["Bob", "Charlie"],
    ["Charlie", "Diana"],
    ["Alice", "Eve"],
    ["Eve", "Diana"]
]
# Creates a network graph showing social connections
Data Classification
# Visualize machine learning results
features_x = [1.2, 2.3, 1.8, 3.1, 2.9, 1.5]
features_y = [2.1, 3.2, 1.9, 4.1, 3.8, 2.2]
predictions = ["Class A", "Class B", "Class A", "Class B", "Class B", "Class A"]
# Creates a classification scatter plot
Scientific Data
# 3D scientific visualization
x_coords = [0, 1, 2, 3, 4]
y_coords = [0, 1, 4, 9, 16]
z_coords = [0, 1, 8, 27, 64]
# Creates a 3D surface or scatter plot
Error Handling
The server includes comprehensive error handling:
- Invalid data format detection
- Missing parameter validation
- Matplotlib rendering error recovery
- File system permission checks
Contributing
- Fork the repository
- Create a feature branch (
git checkout -b feature/amazing-feature) - Commit your changes (
git commit -m 'Add amazing feature') - Push to the branch (
git push origin feature/amazing-feature) - Open a Pull Request
License
This project is licensed under the MIT License - see the LICENSE file for details.
Dependencies
matplotlib: Core plotting librarynetworkx: Graph/network visualizationnumpy: Numerical computationspandas: Data manipulationmcp: MCP server framework
Roadmap
- [ ] Interactive plot widgets
- [ ] Animation support
- [ ] Export to multiple formats (SVG, PDF)
- [ ] Custom color schemes
- [ ] Statistical analysis integration
- [ ] Real-time data streaming plots
Support
If you encounter any issues or have questions:
- Check the Issues page
- Create a new issue with detailed description
- Include sample data and error messages
Made with ❤️ for the MCP ecosystem