Read PostgreSQL EXPLAIN plans for AI agents: bottlenecks, estimation errors, fixes, charts.
dataxplan-mcp
![]()

![]()
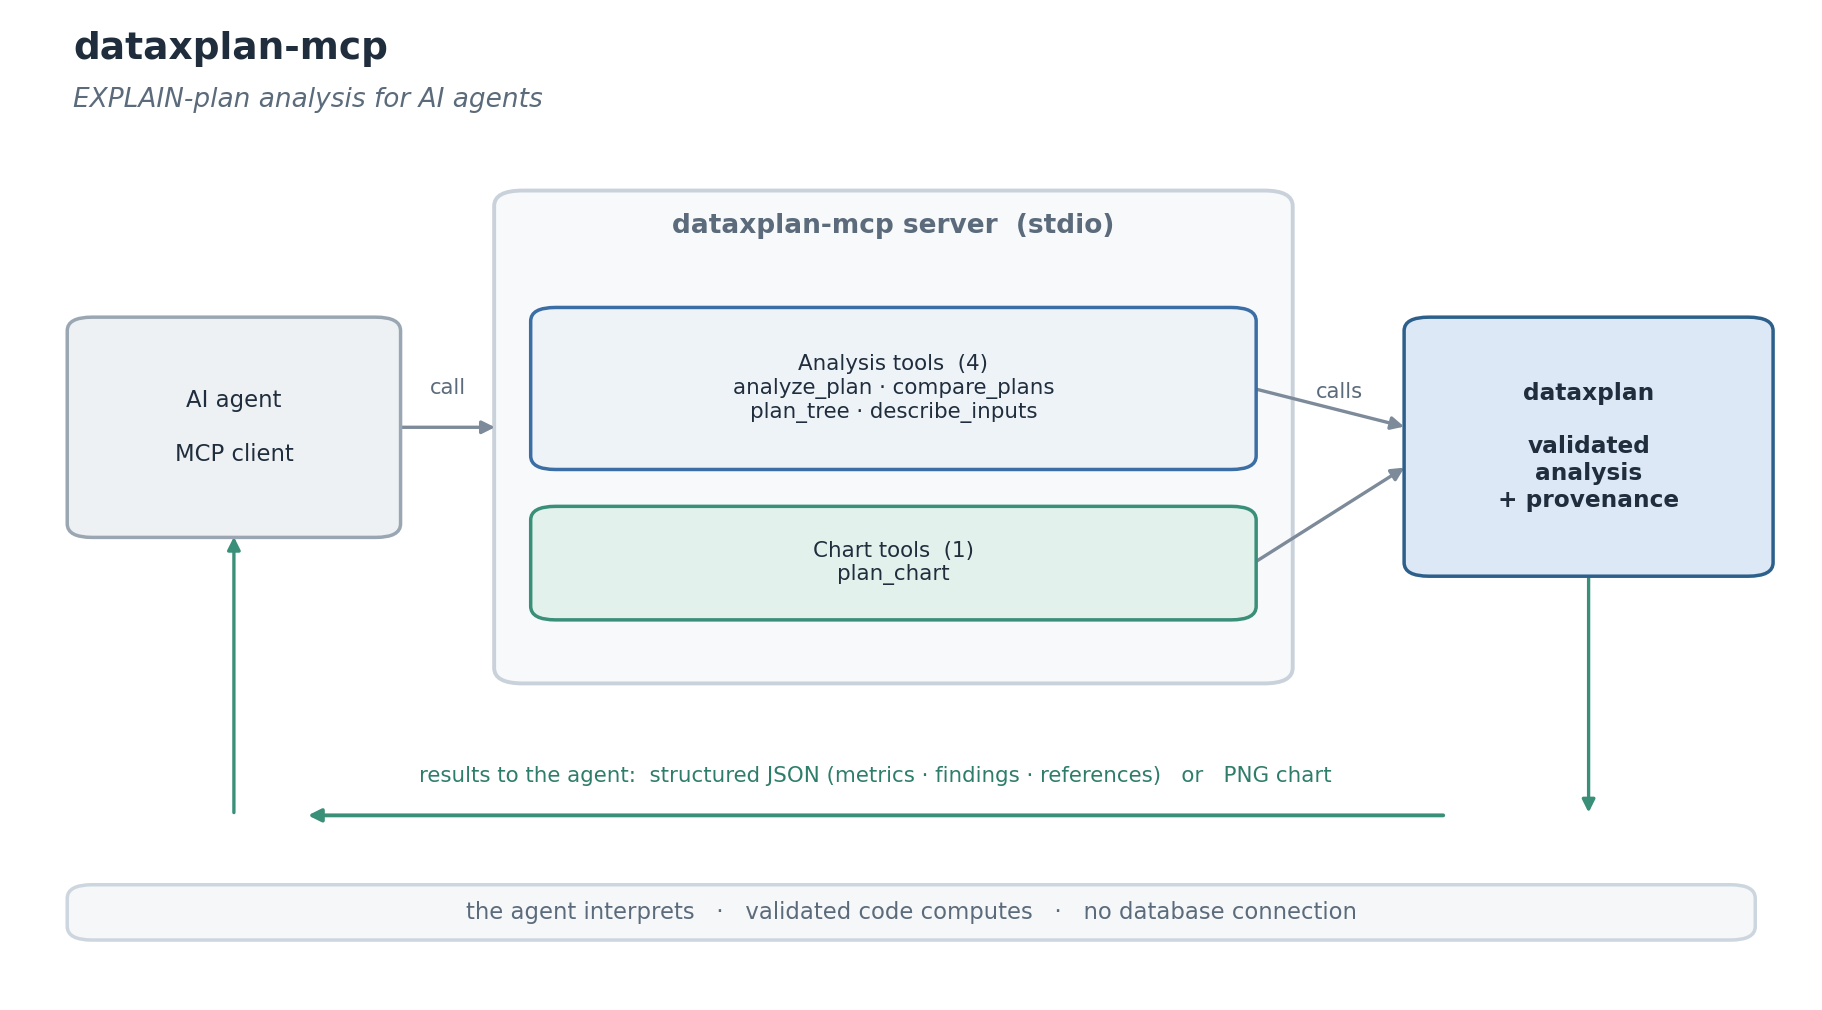
An MCP server that exposes dataxplan,
the PostgreSQL EXPLAIN-plan analyzer for Python, as tools for AI agents: give it
the output of EXPLAIN (ANALYZE, BUFFERS, FORMAT JSON) and it returns the
bottlenecks, the estimation errors, documented findings with a suggested action
and a source reference, a regression comparison, and a self-time chart.
Agents asked why a query is slow tend to eyeball the plan and get it wrong: self time is per loop and inclusive of children, so the slow node is rarely the obvious one, and a row mis-estimate (the usual root cause) is buried in the output. Reading the plan belongs in a deterministic, versioned library that the agent calls, which leaves the agent to interpret the result and decide. The server never connects to a database: the agent runs EXPLAIN and passes the output, so nothing leaves its environment.
Tools
Analysis tools return dataxplan's payload: the metrics, the findings (each with a severity, a suggestion and a documented source reference) and a summary.
| Tool | Purpose |
| ---- | ------- |
| analyze_plan | bottlenecks, estimation errors and findings from an EXPLAIN plan (JSON, text, YAML or XML) |
| compare_plans | compare two plans for regression (timing, shape, estimates, findings) |
| plan_tree | the plan as an annotated text tree (self time, rows, flags per node) |
| describe_inputs | how to produce the plan, the accepted formats, the findings and the thresholds |
Chart tools return a PNG image.
| Tool | Purpose |
| ---- | ------- |
| plan_chart | self time per node, with the high-severity findings highlighted |
All tools are read-only, and the server makes no database connection.
Installation
Run it with uv (no install needed):
uvx dataxplan-mcp
or install from PyPI:
pip install dataxplan-mcp
Configuration
Add it to your MCP client. For example:
{
  "mcpServers": {
    "dataxplan": {
      "command": "uvx",
      "args": ["dataxplan-mcp"]
    }
  }
}
If you installed with pip, use "command": "dataxplan-mcp" with no args.
Example
analyze_plan(plan="<EXPLAIN (ANALYZE, BUFFERS, FORMAT JSON) output>")
  -> { "summary_metrics": { "execution_time_ms": 1240.0,
                            "max_estimation_error": 20000, ... },
       "findings": [ { "id": "seq_scan_hot", "severity": "high",
                       "detail": "... 95% of execution time ...",
                       "suggestion": "consider an index ...",
                       "reference": "PostgreSQL: Using EXPLAIN; the Indexes chapter" } ],
       "summary": "dataxplan - ...\n  execution time ..." }
The agent runs the EXPLAIN itself and pastes the output (any format) as plan.
Design
The server is a thin, stateless wrapper. All of the analysis lives in the dataxplan library, which computes the metrics from the documented EXPLAIN fields and grounds each finding in the PostgreSQL manual (and Leis et al. 2015 for the estimation rules). The server adds the tool schema, read-only annotations and an input-schema helper so an agent can format the input and act on the result. The findings are documented heuristics, not guarantees, and the server connects to nothing.
Related
- dataxplan: the library this server wraps.
License
MIT. Written and maintained by Atakan Arikan, MSc Student at Tsinghua University and Politecnico di Milano.